
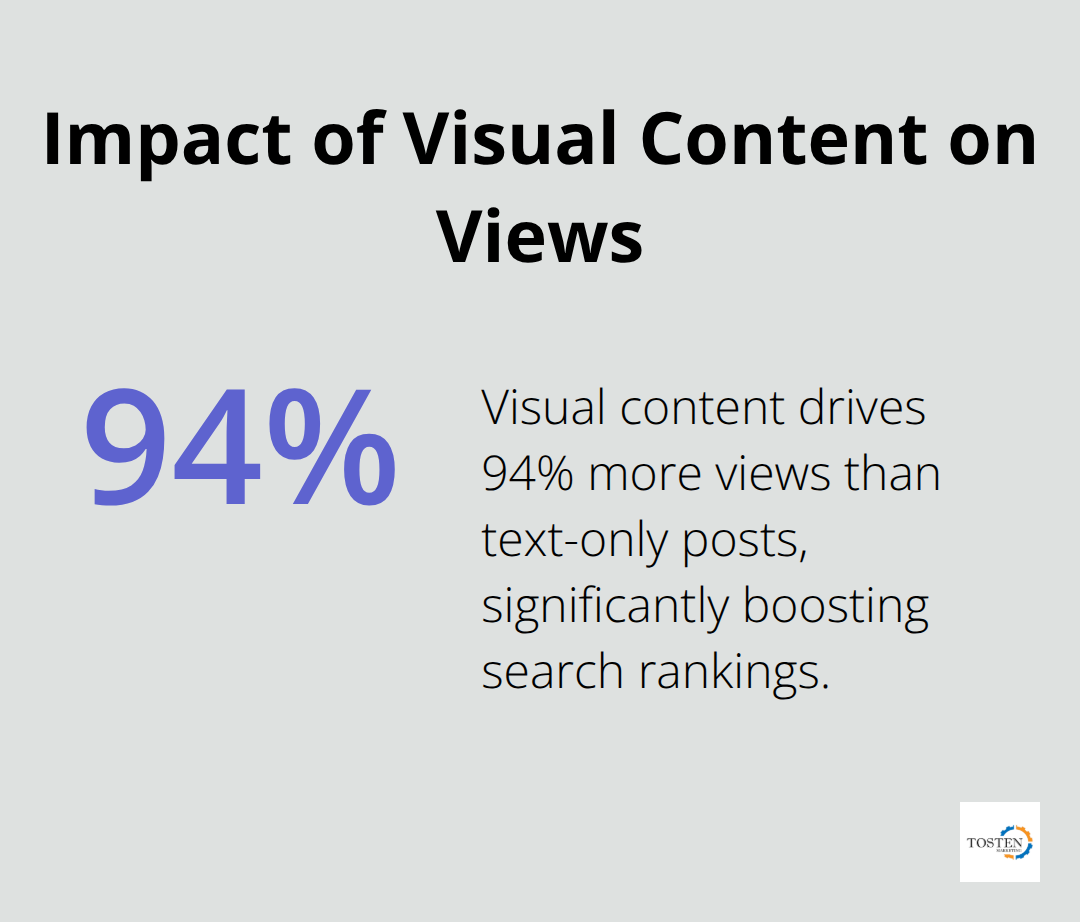
Visual content drives 94% more views than text-only posts, making infographics a game-changer for search rankings. When done right, these data-rich graphics generate powerful backlinks and boost social engagement.
At Tosten Marketing, we’ve seen how strategic infographics and SEO work together to increase organic traffic by up to 12 times. The key lies in proper optimization and smart promotion tactics.
Why Infographics Transform SEO Performance
Infographics are powerful tools for content marketing that can drive web traffic, increase brand awareness, and build high-quality backlinks. Publishers actively seek visual content that simplifies complex data, and a well-designed infographic becomes their go-to resource for citations. Statistical infographics perform exceptionally well because they centralize industry data that journalists and bloggers need for their articles. Content Marketing Institute data shows that visual content receives 650% more engagement than text-only posts, which directly translates to increased social shares across platforms like LinkedIn and Pinterest.
Backlink Generation Power
Search engines prioritize pages with strong backlink profiles, and infographics excel at earning these organic links without direct outreach efforts. The embed code strategy works particularly well – you provide ready-to-use HTML code below your infographic and encourage other sites to share while they link back to your domain. Venngage case studies demonstrate how targeted infographic campaigns increased monthly organic traffic from 275,000 to 900,000 within one year through strategic backlink generation (a 227% increase).
Enhanced User Experience Metrics
Page dwell time increases significantly when users encounter visual content, with humans retaining 65% of visual information compared to just 10% of text-based content. Infographics reduce bounce rates when they present complex information in digestible formats and keep visitors engaged longer. Google’s algorithm recognizes this improved user behavior and rewards pages with better search rankings. Mobile-optimized infographics perform especially well since 60% of searches now occur on mobile devices (where visual content loads faster and displays more effectively than dense text blocks).
Social Media Amplification
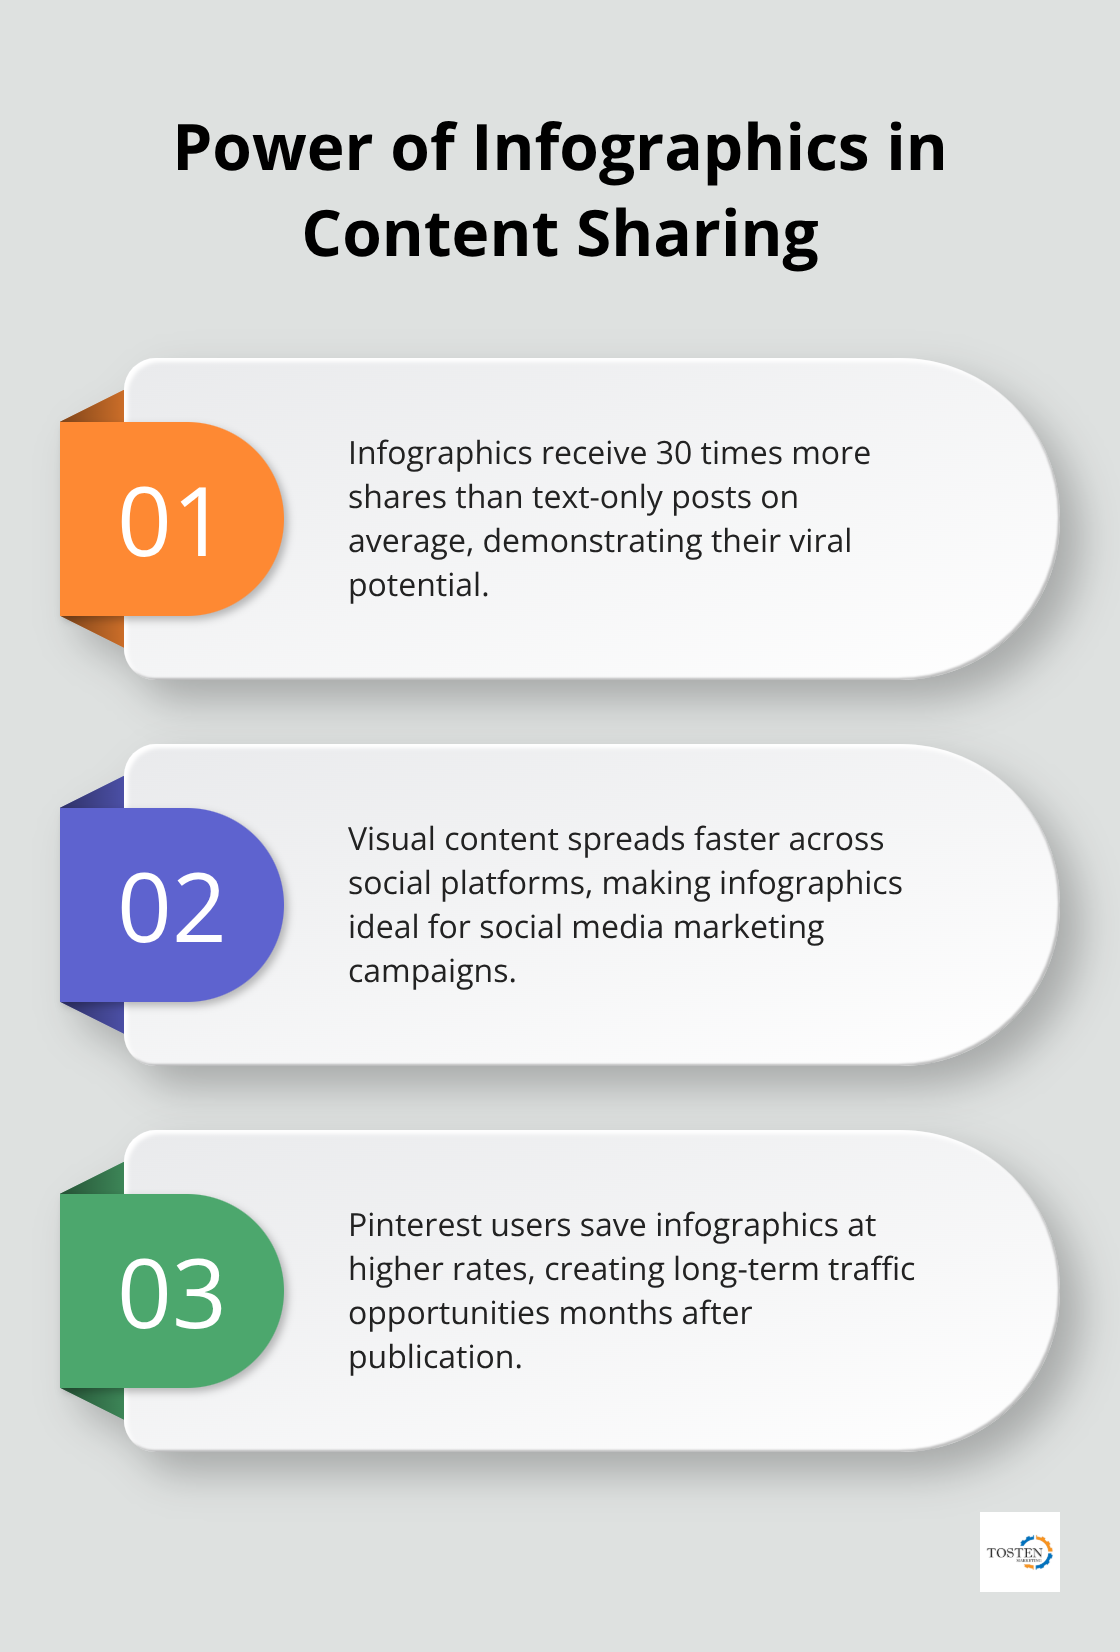
Visual content spreads faster across social platforms, with infographics receiving 30 times more shares than text-only posts on average. Pinterest users save infographics at higher rates, which creates long-term traffic opportunities as these pins continue to drive clicks months after publication. LinkedIn professionals share data-rich infographics to establish thought leadership, while Twitter users retweet visual statistics to support their arguments in industry discussions.
These performance advantages set the foundation for creating infographics that search engines and users both love – but success depends on proper SEO content marketing strategy techniques from the start.
How Do You Build SEO-Optimized Infographics
Keyword research forms the backbone of successful infographic SEO strategy. Start with tools like SEMrush or Ahrefs to identify long-tail keywords with search volumes between 1,000-5,000 monthly searches and low competition scores under 30. Focus on data-driven topics where your industry lacks comprehensive visual resources.
Statistical queries work exceptionally well – terms like industry name plus statistics, trends, or data consistently generate more backlinks than general topics. Research shows that many marketers fail to optimize infographics properly, which creates massive opportunities for those who target specific keyword phrases in their visual content strategy.
Design Elements That Drive Rankings
Width matters significantly for search visibility. Google prioritizes infographics that measure at least 1,200 pixels wide, as these dimensions display properly across desktop and mobile devices. Keep file sizes under 1MB with tools like TinyPNG to maintain fast page load speeds (mobile users abandon pages that take longer than three seconds to load).
Color psychology drives engagement rates according to visual marketing studies, so implement consistent brand colors with high contrast ratios for text readability. Organize information hierarchically with clear headings, subheadings, and data points that users can scan quickly on mobile screens.
Technical Optimization That Search Engines Love
File names directly impact image search rankings. Replace generic names like infographic1.jpg with keyword-rich descriptors such as insurance-industry-statistics-2024.png. Alt text descriptions should contain your target keyword naturally while they describe the visual content in 125 characters or less.
Include schema markup for enhanced rich snippets – this structured data helps Google display your infographics in featured snippet positions (which receive higher click-through rates than standard results). The HTML embed code technique generates passive backlinks when other sites share your visual content while they link back to your domain automatically.
These optimization techniques set the foundation, but your infographic’s success depends heavily on how you promote it across the right channels and platforms. Infographics can increase web traffic by up to 12% when properly distributed through social media marketing and lead generation strategies.
How Do You Promote Infographics for Maximum SEO Impact
Your distribution strategy determines whether your infographic generates 10 backlinks or 1,000 backlinks. Submit to infographic directories like Visual.ly, Infographic Journal, and Daily Infographic within 24 hours of publication. These platforms maintain domain authority scores above 50 and actively promote new submissions to their subscriber bases. Target niche directories specific to your industry – insurance infographics perform exceptionally well on InsuranceNewsNet and PropertyCasualty360, which reach decision-makers who frequently cite visual data in their articles.
Targeted Outreach That Generates Links
Email outreach to industry publications yields the highest return on investment for backlink generation. Research shows that personalized outreach emails achieve 15% response rates compared to 2% for generic templates. Target websites that have published similar statistical content within the past six months and offer your infographic as a supplementary resource. Include the embed code directly in your pitch email and mention specific articles where your data would add value. Industry journalists at publications like Insurance Journal and Risk Management Magazine actively seek visual content to support their stories, especially during quarterly periods when they need current statistics.
Social Media Amplification Strategies
LinkedIn generates the highest rates for B2B infographics, with professional posts receiving 277% more shares than Facebook content (according to HubSpot research). Post your infographic during peak times on weekdays, and use industry-specific hashtags like InsuranceTech or RiskManagement to reach targeted audiences. Pinterest drives long-term traffic through its search functionality – create multiple pins with different titles and descriptions to capture various search queries. Twitter works best for real-time industry discussions, so share key statistics as individual tweets with visuals extracted from your main infographic.
Directory Submission Strategy
Submit your infographic to high-authority directories within your first week of publication. Visual content directories like Cool Infographics and Infographic Bee actively curate submissions and feature quality content on their homepages. Industry-specific directories often provide better backlink quality than general submission sites. Insurance professionals frequently browse specialized directories when they research market trends and statistics for their own content creation.
Final Thoughts
Infographics and SEO create powerful results when you combine them strategically in your digital marketing efforts. Visual content generates 178% more backlinks than text-only posts and increases social engagement by 650%. Proper keyword optimization, strategic design elements, and targeted promotion drive sustainable organic traffic growth that compounds over time.
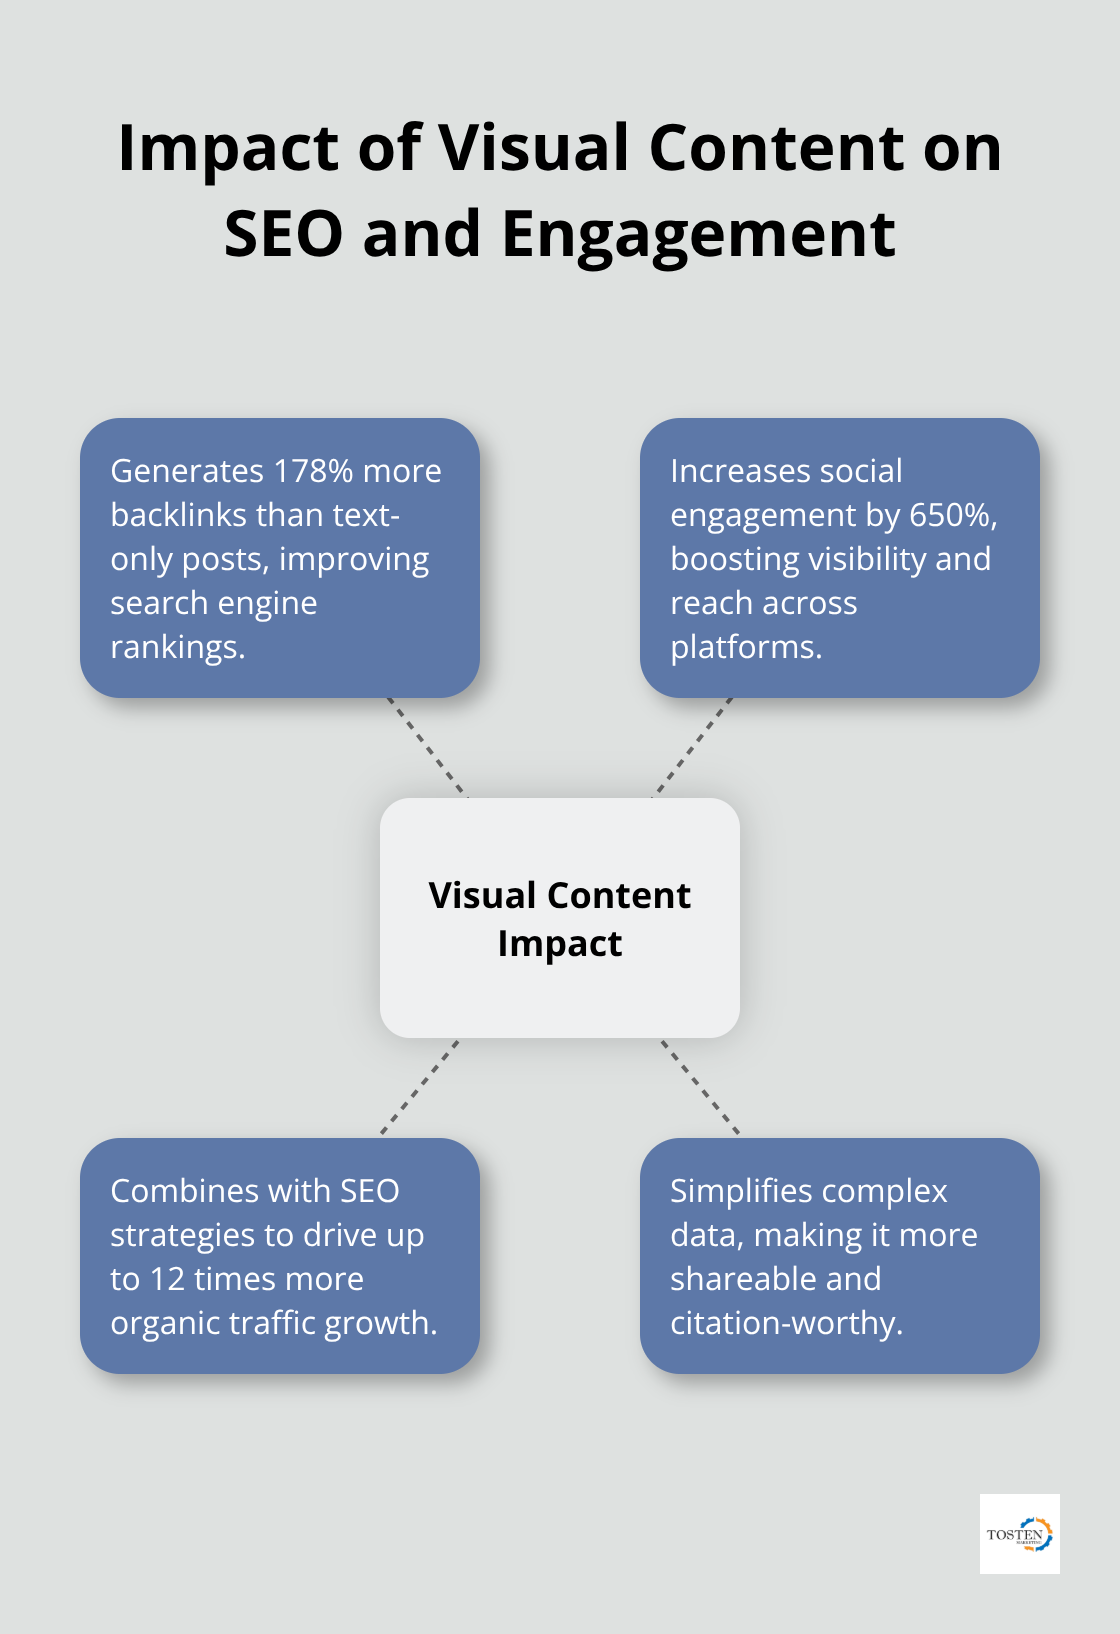
Success demands consistent implementation across three key areas: you must create data-rich visuals with proper technical optimization, build high-quality backlinks through strategic outreach, and amplify reach through social media platforms. Companies that follow these strategies see traffic increases of up to 12 times their baseline performance (with some achieving even higher growth rates). The insurance industry particularly benefits from statistical infographics that simplify complex data for potential clients.
We at Tosten Marketing integrate visual content strategies with comprehensive SEO services to help insurance agencies build stronger online visibility. Our digital marketing solutions combine infographic creation with ongoing optimization to maximize search rankings and lead generation. This approach delivers measurable results that support long-term business growth in competitive markets.