

Google Analytics For Insurance Agents – What to look at and how to utilize the data
It isn’t uncommon for a customer to ask for access to their Google Analytics data. While we are always happy to provide this, having access to your website data is only as good as your understandings of the data. Today I’ll cover the top 5 areas you should familiarize yourself with on your Analytics report.
Acquisition Channels – Where did the site visitor originate?
Understanding how your website is getting traffic is one of the most important parts of marketing your insurance agency website. If you know how people are getting there, it can provide great insights into how your overall marketing campaigns are performing.
Acquisition channels are broken up into 6 main categories.
- Organic Search – This is where your SEO campaign shines. Is your website getting organic traffic? This means you showed up in search results as a result to a search in Google or Bing and the visitor clicked through to your site.
- Direct Traffic – Direct traffic is when someone goes directly to your website. For instance, if you’re looking for Tosten Marketing and you just type in: http://tostenmarketing.com into a search browser.
- Display – Paid search traffic that gets visitors to your site by displaying an advertisement on another site. Banner ads and image ads are the most common display ads.
- Referral Traffic – When someone is browsing another website and sees a link to your site embedded in an article or in a listing such as a directory listing.
- Paid Search – Traffic to your site that is generated by running paid ads in search engines such as Google and Bing.
- Social – Traffic to your site that came from a social media platform like Facebook, LinkedIn and Twitter.
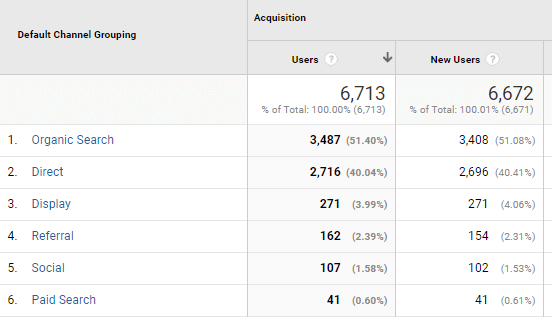
How to see your acquisition channels:
From your main dashboard on the left hand side, navigate to Acquisition -> All Traffic -> Channels.
Audience Location – Where are the people physically located who visit your site?
Over the years I’ve worked with hundreds of insurance agencies. Most I’d say only look at a number in their analytics for how many people visited their website. The more important question than how many is where.
For example. If you’re a licensed independent insurance agent in Texas, getting traffic from Canada, India and Japan really doesn’t do your website any good.
If your marketing is working correctly, you should get the bulk of your website traffic from the United States and furthermore, from the state that you have a physical presence in.
Identifying your audience location can be a great sign that your SEO and other digital marketing is working correctly. If you’re seeing a lot of traffic from other countries you’ll want to identify why. Perhaps you have a paid search campaign that isn’t properly setup, or it could even be a good indicator that you site may have malware.
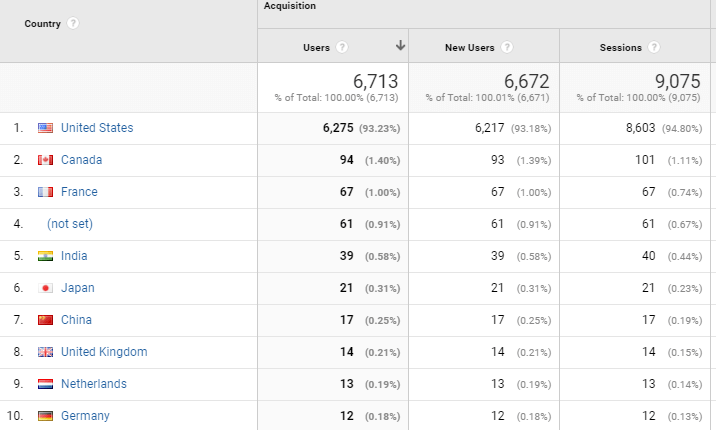
How to see your Audience Location:
From the main dashboard on the left hand side, navigate to: Audience -> Geo -> Location (then if you want more specific state data, click on United States).
Audience Device – What type device did the visitor browse your site from?: Desktop, Mobile or Tablet
The importance of understanding what type of device the user visited your website with is important for a few reasons.
You can measure time on site and abandon rate variances between devices. Knowing this can help you identify opportunities such as improving bounce rate or time on site. For instance, if you see mobile has a high abandon rate, it may be because your site loads slowly or displays poorly on a mobile device.
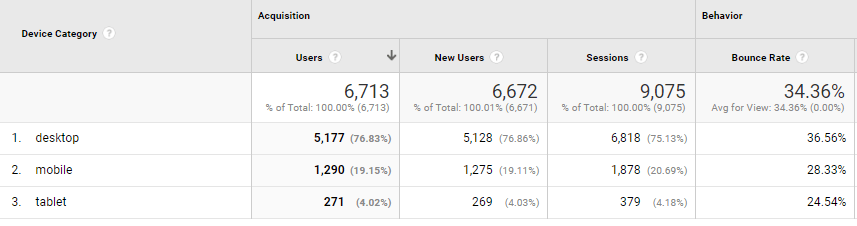
How to see your Device Usage Type:
From the main dashboard on the left hand side, navigate to: Audience -> Mobile -> Overview
Site Content Overview: What pages did the user look at on your site?
Understanding what content on your site people visited can give you great insights into where your site is performing well or understanding where it is performing poorly. However, low traffic doesn’t always indicate poor performance – it may simply indicate low search volumes.
For instance, if the auto insurance page of your website has 100 visitors a month and your funeral home insurance page of your website has 2 visitors, it is likely because not many people are searching for “funeral home insurance.”
By understanding what content on your website is performing well and what content might be standing out can give you rich insights to do more targeted content around that topic that is driving traffic to your site.
How to identify Site Content
From the main dashboard on the left hand side, navigate to: Behavior -> Site Content -> All Pages
Site Speed Suggestions: How quickly is your site loading and what can be done to improve?
Because speed is an SEO factor it is important to pay attention to a slow loading website. Google Analytics gives free insight and scores each of your pages with a PageSpeed score. This quick look can help you identify issues with your site and work with your website developer to improve these metrics.
For page speed, aim for a score of 80+. Perfection is impossible so a score of 80 or higher is a good goal.
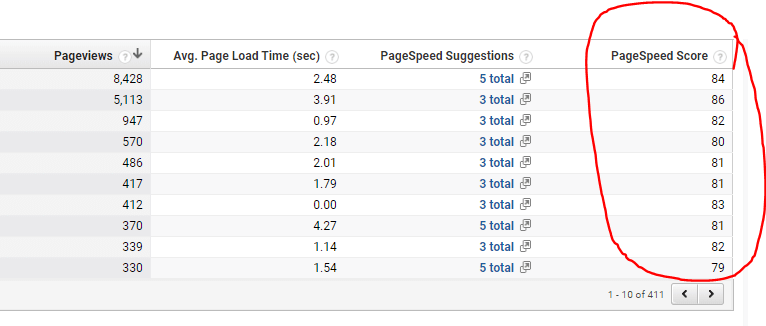
How to view your Page Speed
From the main dashboard on the left hand side, navigate to: Behavior -> Site Speed -> Speed Suggestions.
Understanding these Google Analytics measurements will not only help you understand how your site is performing, but can help you identify issues with the site, issues with your digital marketing or areas in which you can simply improve upon. Ultimately you don’t need to spend too much time overanalyzing your reports. If you’re overwhelmed, a website audit can help identify areas of opportunity.
We hope you’ve found this post on Understanding Your Insurance Agency Website Google Analytics Reports helpful. By paying attention to these reports, you can continue to improve your website with the tools that the search engines give you.